Table Plots
Table plots are simply plots of descriptive tables, with optional formatting, and can be generated using the fig_table() function, which returns a Plotly Go Figure object.
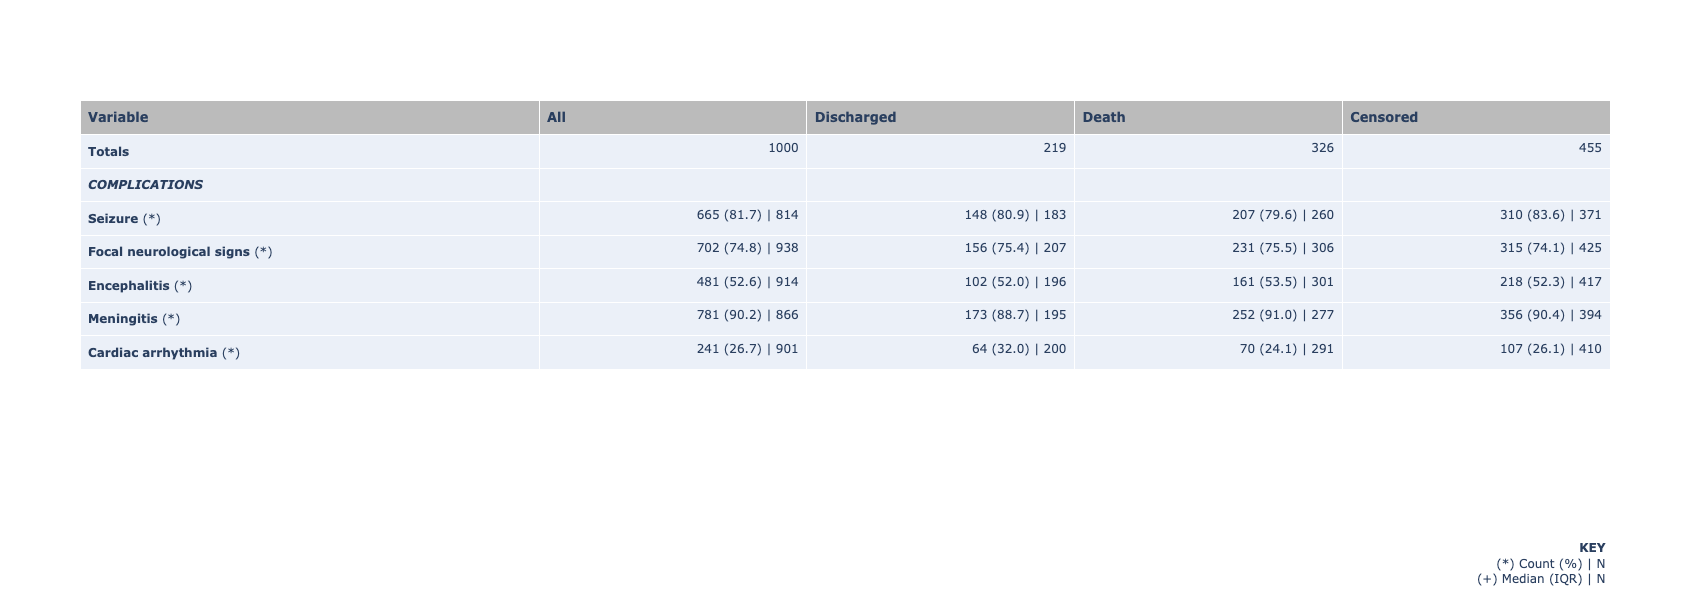
The plot above was generated using a synthetic dataset of selected patient treatment complications for Dengue. Click the image to view the full interactive and fully annotated Plotly Go figure.
The synthetic dataset is given below as a table (which can easily be converted to a CSV).
Complication / Outcome Variable |
Patient Count |
Discharged |
Death |
Censored |
|---|---|---|---|---|
All / Any |
1000 |
219 |
326 |
455 |
Seizure |
665 (81.7%, N=814) |
148 (80.9%, N=183) |
207 (79.6%, N=260) |
310 (83.6%, N=371) |
Focal neurological signs |
702 (74.8%, N=938) |
156 (75.4%, N=207) |
231 (75.5%, N=306) |
315 (74.1%, N=425) |
Encephalitis |
481 (52.6%, N=914) |
102 (52.0%, N=196) |
161 (53.5%, N=301) |
218 (52.3%, N=417) |
Meningitis |
781 (90.2%, N=866) |
173 (88.7%, N=195) |
252 (91.0%, N=277) |
356 (90.4%, N=394) |
Cardiac arrhythmia |
241 (26.7%, N=901) |
64 (32.0%, N=200) |
70 (24.1%, N=291) |
107 (26.1%, N=410) |
The fig_table() function does not expect a dataframe in any particular format, except that it should correspond to the kind of table shown in the example above. If the cell values require formatting then formatting should be applied either to the dataframe or the source file from which it was loaded.
Here are the Python steps you need to generate the plot above using the fig_table() function:
import pandas as pd
from isaricanalytics.visualisation import fig_sunburst
# Load the CSV data from a string buffer
data = pd.read_csv(io.StringIO(
    """
    Variable,All,Discharged,Death,Censored
    <b>Totals</b>,1000,219,326,455
    <b><i>COMPLICATIONS</i></b>,,,,
    <b>Seizure</b> (*),665 (81.7) | 814,148 (80.9) | 183,207 (79.6) | 260,310 (83.6) | 371
    <b>Focal neurological signs</b> (*),702 (74.8) | 938,156 (75.4) | 207,231 (75.5) | 306,315 (74.1) | 425
    <b>Encephalitis</b> (*),481 (52.6) | 914,102 (52.0) | 196,161 (53.5) | 301,218 (52.3) | 417
    <b>Meningitis</b> (*),781 (90.2) | 866,173 (88.7) | 195,252 (91.0) | 277,356 (90.4) | 394
    <b>Cardiac arrhythmia</b> (*),241 (26.7) | 901,64 (32.0) | 200,70 (24.1) | 291,107 (26.1) | 410
    """
), skipinitialspace=True)
# Create and display the figure
fig = fig_table(
    data,
    title="Table of Synthetic Dengue Patient Complications",
    height=500
)
fig.show()
You should see the plot appearing as given above.
Note
In the example above, most cell values contain formatting to make the rendered table more readable. These can be omitted if formatting is not required.
Note
Any dataframe or CSV column names, or dictionary field labels, in the example above that are not specific to the dataset must be as given, otherwise the function may throw an exception or return an incorrect figure.
Also, the height parameter, which is optional with a default of 350,
can be used to customise the plot height. Refer to the
fig_frequency() function
docstring for more information.