Visualisation
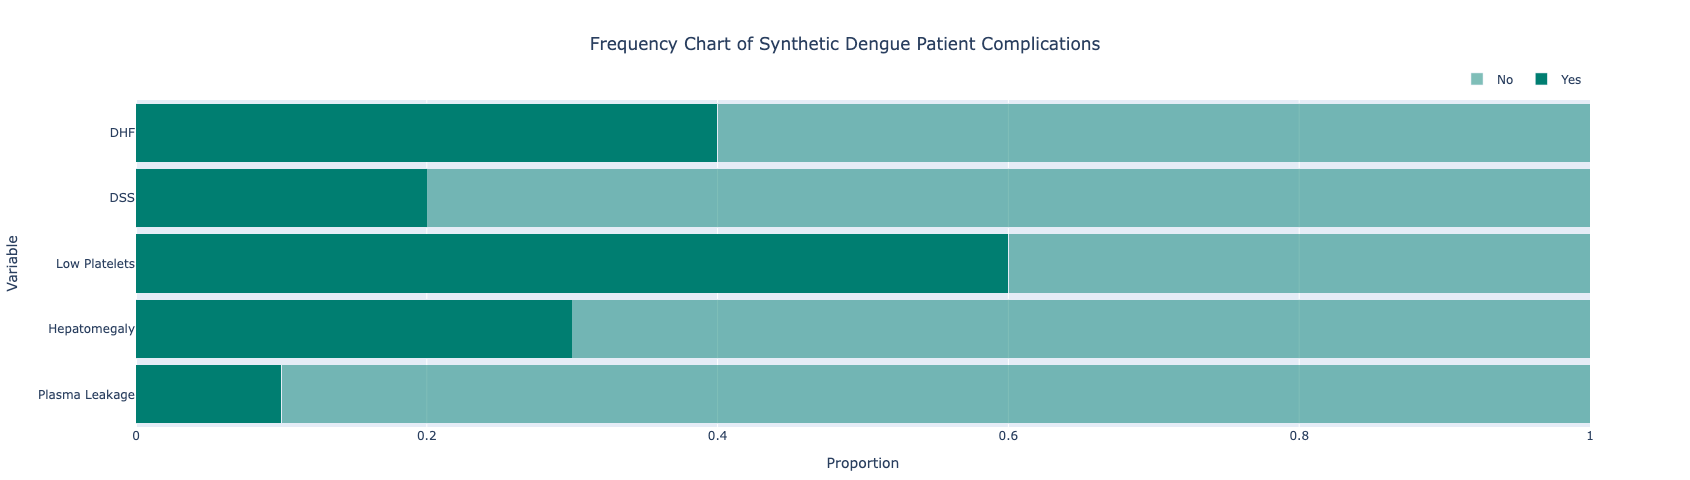
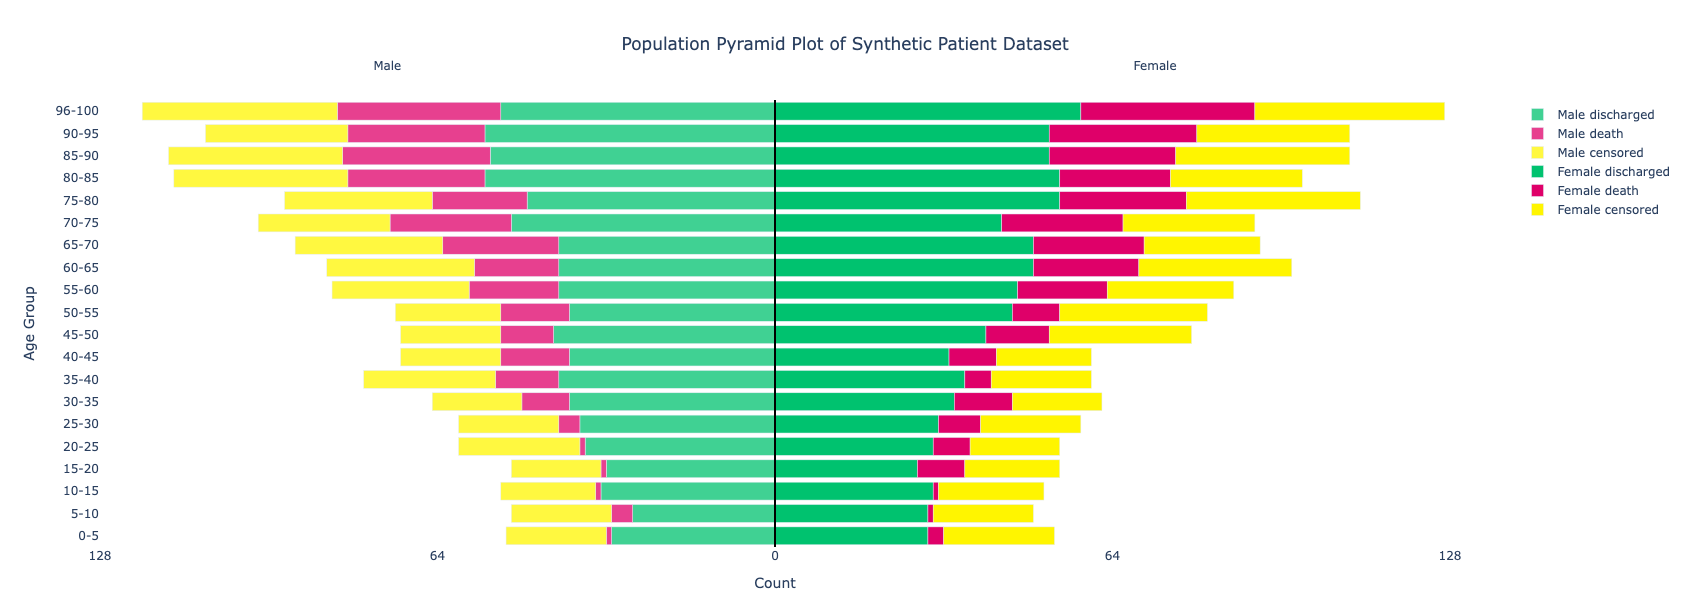
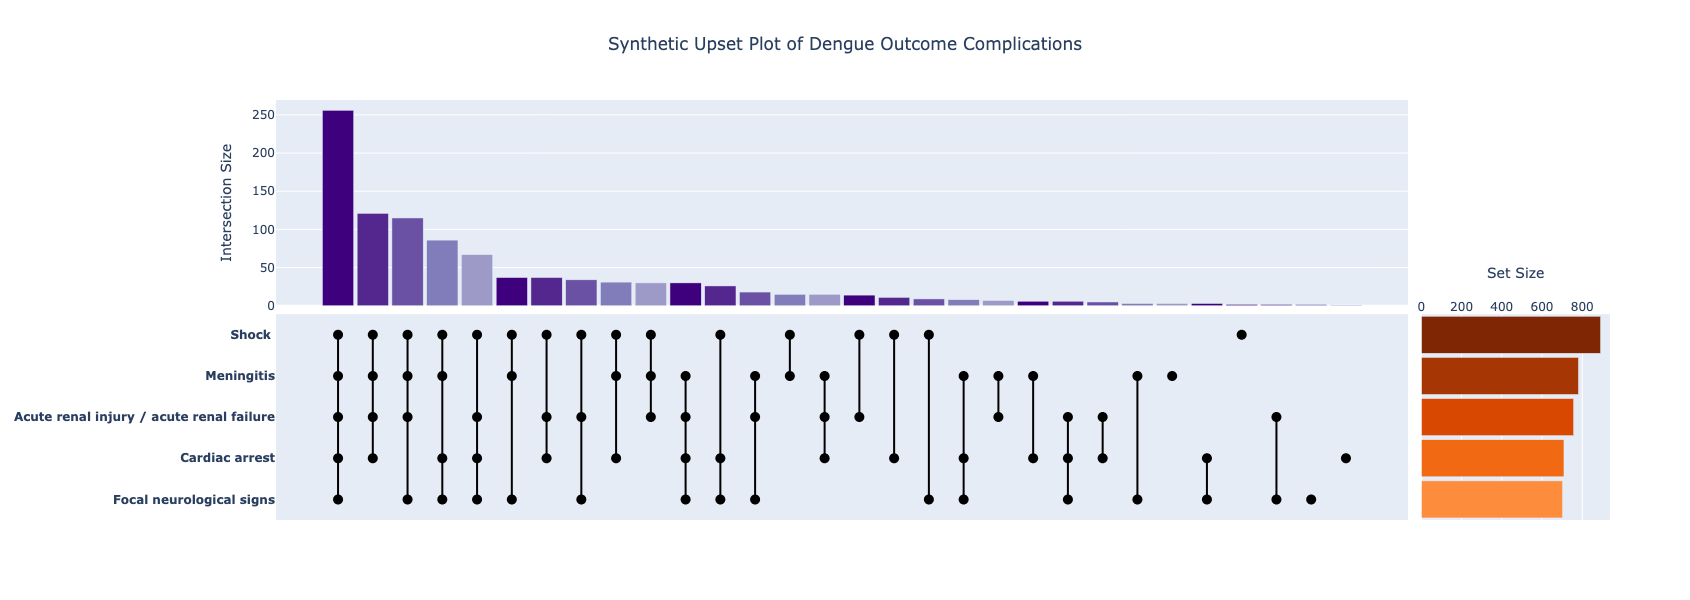
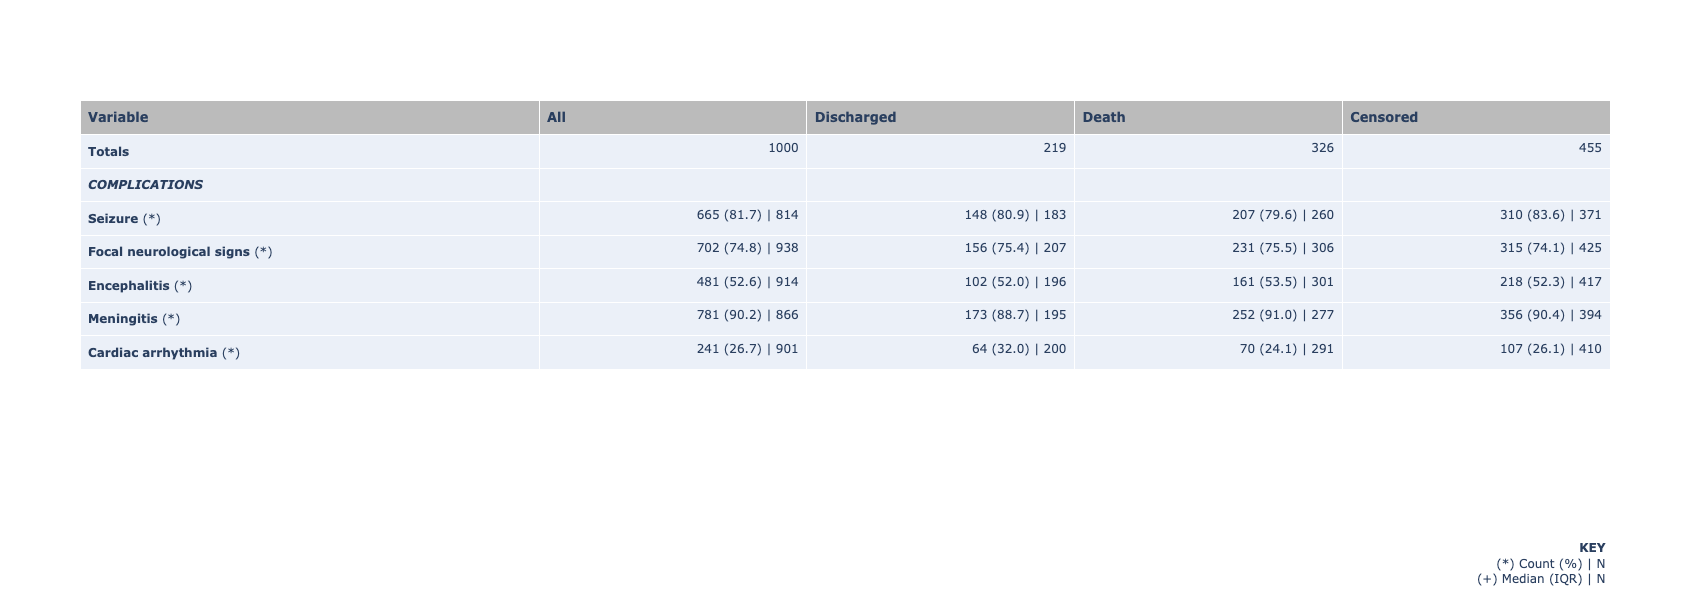
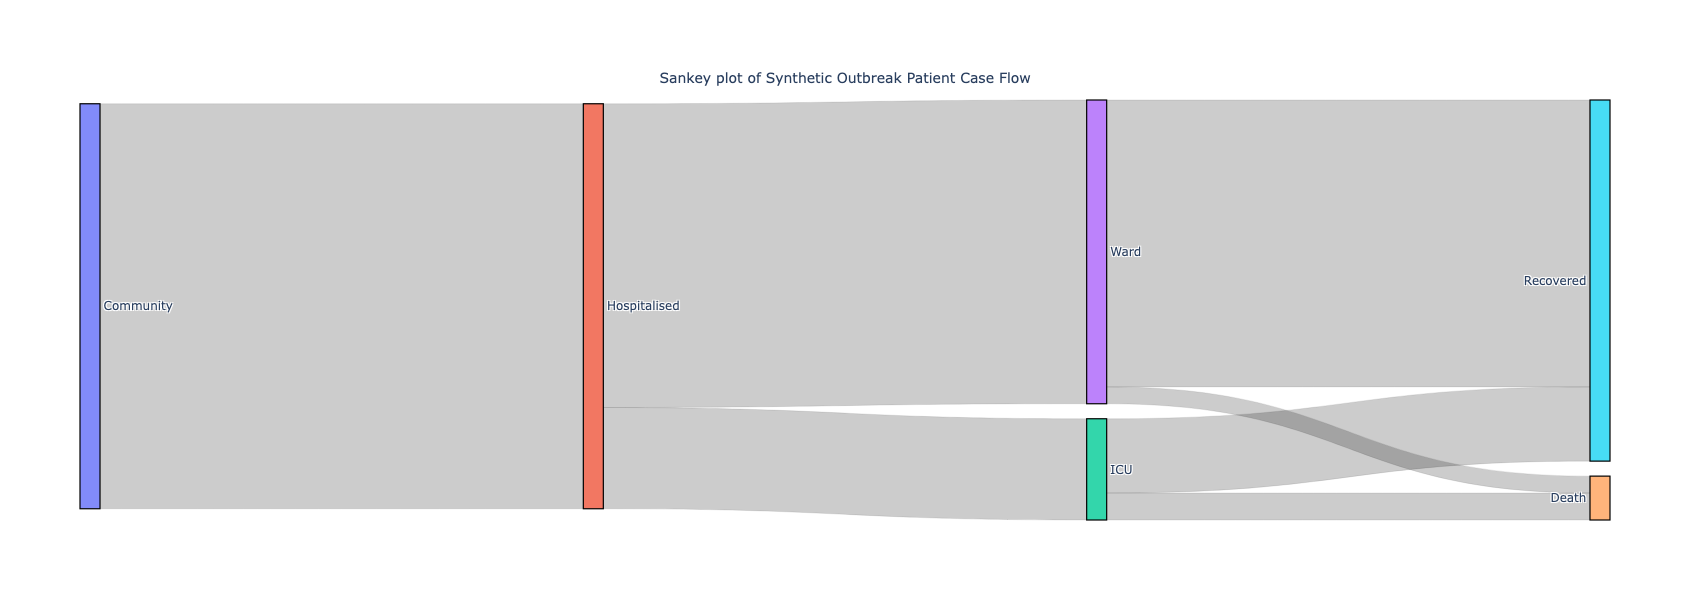
A variety of figures / plots can be generated using functions in the visualisation library. All functions return a Plotly Go Figure object.
Click on the plot panels below for more details - not every function in the library has a plot panel, but more will be added over time.