Visualisation
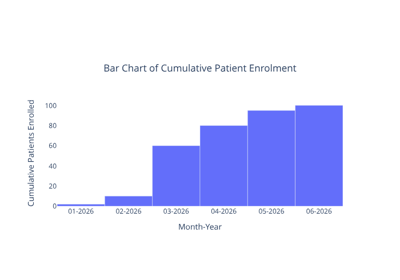
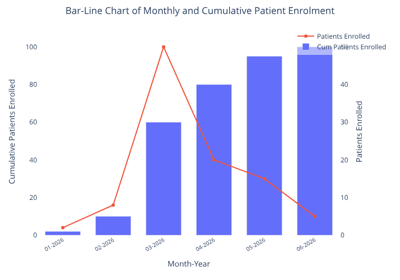
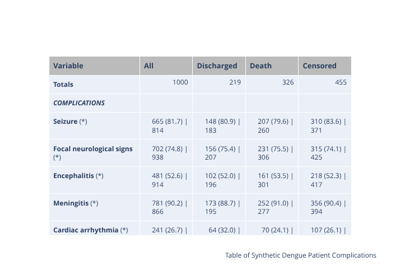
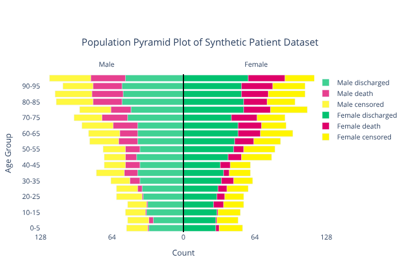
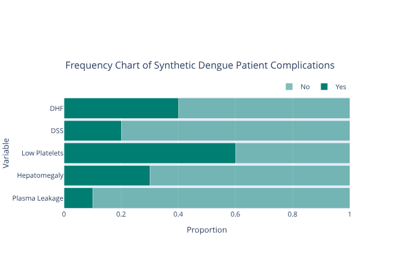
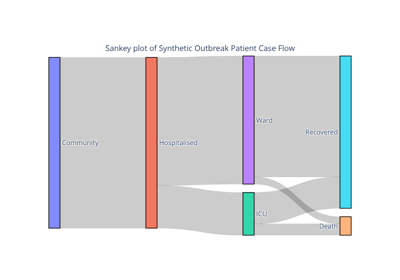
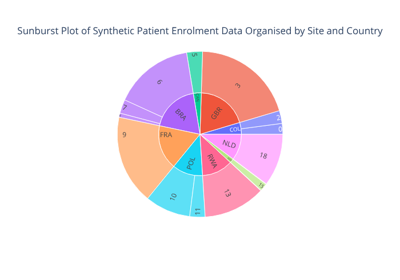
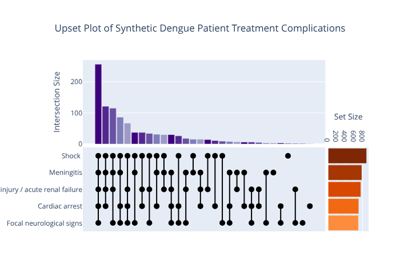
A variety of figures / plots can be generated using figure functions in the visualisation library, and this can be explored in more detail in the plot gallery below. Note that all functions return a Plotly Go Figure object.
Note
All visible figures in the gallery are dynamically generated from Python scripts in the docs/sources/plot-gallery/examples folder of this repository. These scripts can be obtained by clicking on the Download buttons presented on the bottom of this page. The scripts require CSVs, also contained in the docs/sources/plot-gallery/examples folder, but are not included with the download options: you can obtain these manually from a clone of the repository or a fork/.
Note
The plot gallery is under development, and not all figure functions in visualisation have a corresponding panel in the plot gallery. More panels will be added over time.